¶ General information
All dates shown refer to the selected date. To change the period, click on the date.
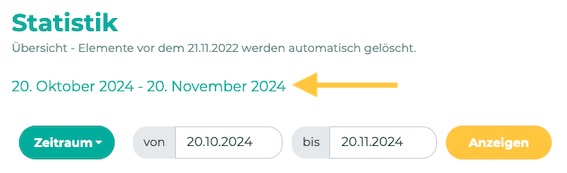
The figures in the statistics change depending on the period selected.
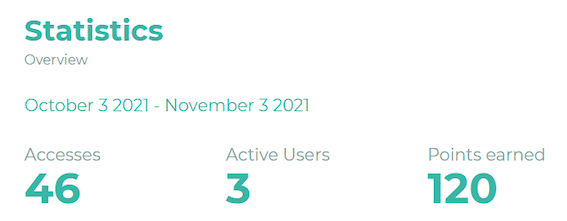
Access counts all logins of all users (however, multiple accesses by a user within an hour only count as ONE access)
Active Users are all employees who have logged in at least once (app or web browser).
Points earned shows the points earned by users in period X.
Posts read/liked/comments/shared shows the interactions with posts in the news. A post is counted as read if it is marked as read.
Chats shows the total number of chats (including group chats). Participants are all users who are involved in a chat. The messages are all messages from all chats for the period.
Bulletin board record(s)/comments/likes refer to interactions with posts on the bulletin board for period X.
¶ Charts, graphs and diagrams
To illustrate the numbers, Statistics includes a number of charts and graphs that can help you with your analysis:
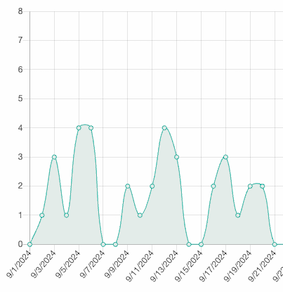
¶ Accesses
Here you can see a graph showing the accesses to the application during the specified period. If you move the mouse over the curves, you will see the number of hits for each day.
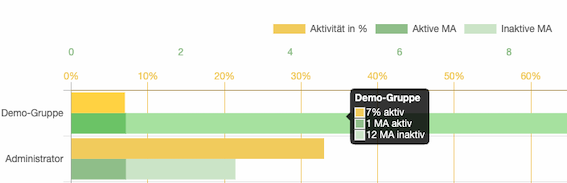
¶ Accesses (Groups)
This category shows the activity of employees within a group. This allows you to see which group of colleagues is using the application the most. If you move the mouse over the colored fields, the activity will be broken down in more detail.
¶ Devices
In this section you can see which devices, browsers, etc. are used to access the application.
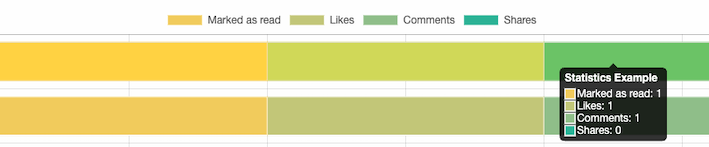
¶ Posts (Interactions)
Here you can see the interactions with each post in the news. If you move your mouse over the colored fields of the graphs, the number of likes, etc. will be displayed in numbers.
¶ Posts (Views)
Views
Views are all views of all employees. Each new view is counted.
Views Sessions
In contrast, a view session is a group of views made by an employee in a session. For view sessions, only one view per contributor is counted within a session, even if the post was clicked multiple times.
For example: If the user has the app open for about ten minutes and views the post five times in a row, it counts as one view per session.
Views Unique
The unique views show how many different people actually viewed the post. Multiple views are not counted.
¶ Tags in posts
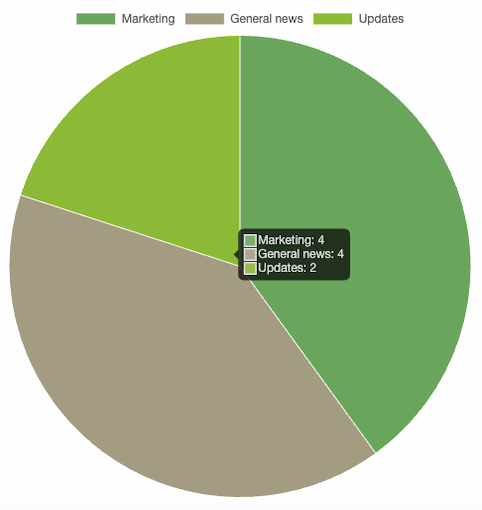
Here you can see which tags were used in the posts (in the news) and how often in the specified period. For this example, we have created the tags Marketing, News general and Updates. If you move the mouse over the colored fields of the charts, the number of likes etc. is displayed again in figures.
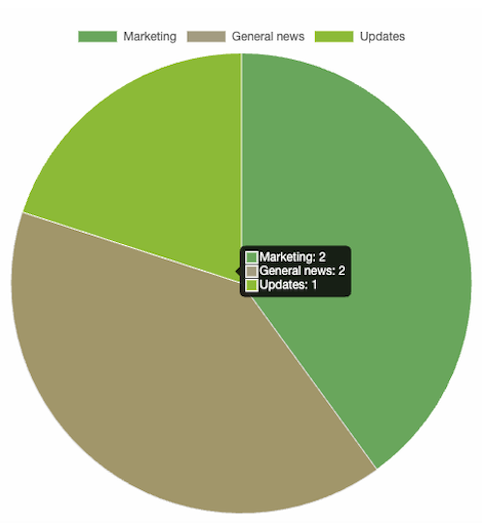
¶ Popular tags in posts
This graph shows how often the tagged posts have been interacted with (e.g. likes and comments). For this example, we also use the tags marketing, news in general, and updates. If someone comments on a post with the Marketing tag, that will count as one point for Marketing in the stats. If someone likes the post and comments on it, two points are counted for Marketing. If the post has multiple tags, an interaction is always counted for all tags used. If you move your mouse over the colored areas of the graphs, the number of likes, etc. will be displayed in numbers again.
¶ Pages & Menu (Views)
Here you can see the views for your pages: From news to individual custom pages.
Views
Views are all views of all employees. Each new view is counted.
Views Sessions
In contrast, a view session is a group of views made by an employee in a session. For view sessions, only one view per contributor is counted within a session, even if the page was clicked multiple times.
For example: If the user has the app open for about ten minutes and views the page five times in a row, it counts as one view per session.
Views Unique
The unique views show how many different people actually viewed the page. Multiple views are not counted.
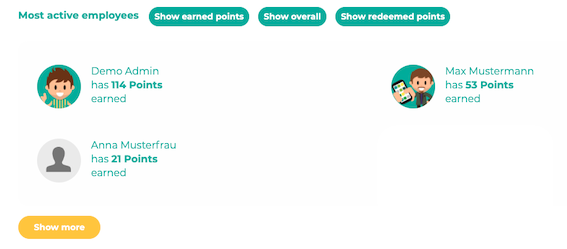
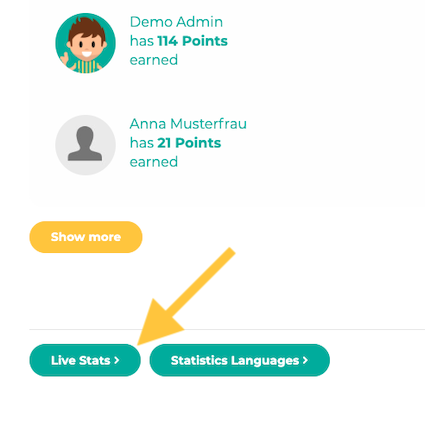
¶ Points Balance
Provides an overview of the employee's points balance, as well as points earned and redeemed.
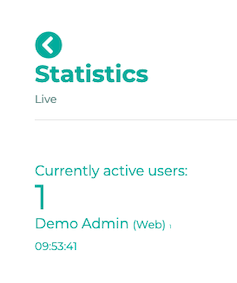
¶ Live statistics
Click on Live Stats to see the number, identity (first name and surname) and application used (website or app) of the employees currently logged in.
If you would like to deactivate this option, e.g. for data protection reasons, please contact our support: support@lolyo.net.